Baloney Inspection Report: Claim #1133 · Inspected Oct 6, 2026, 9:32 PM PDT · Scoring model v2
98%
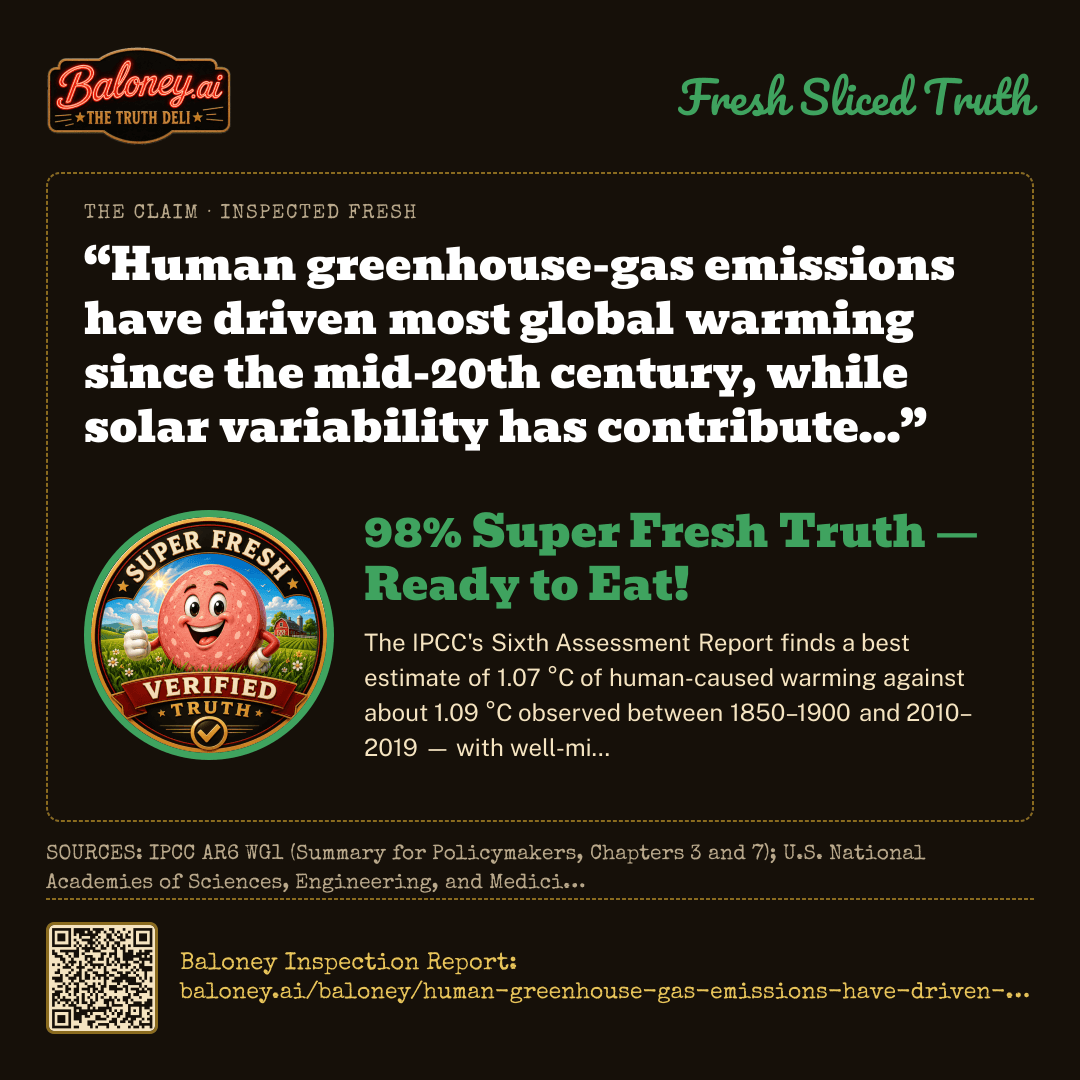
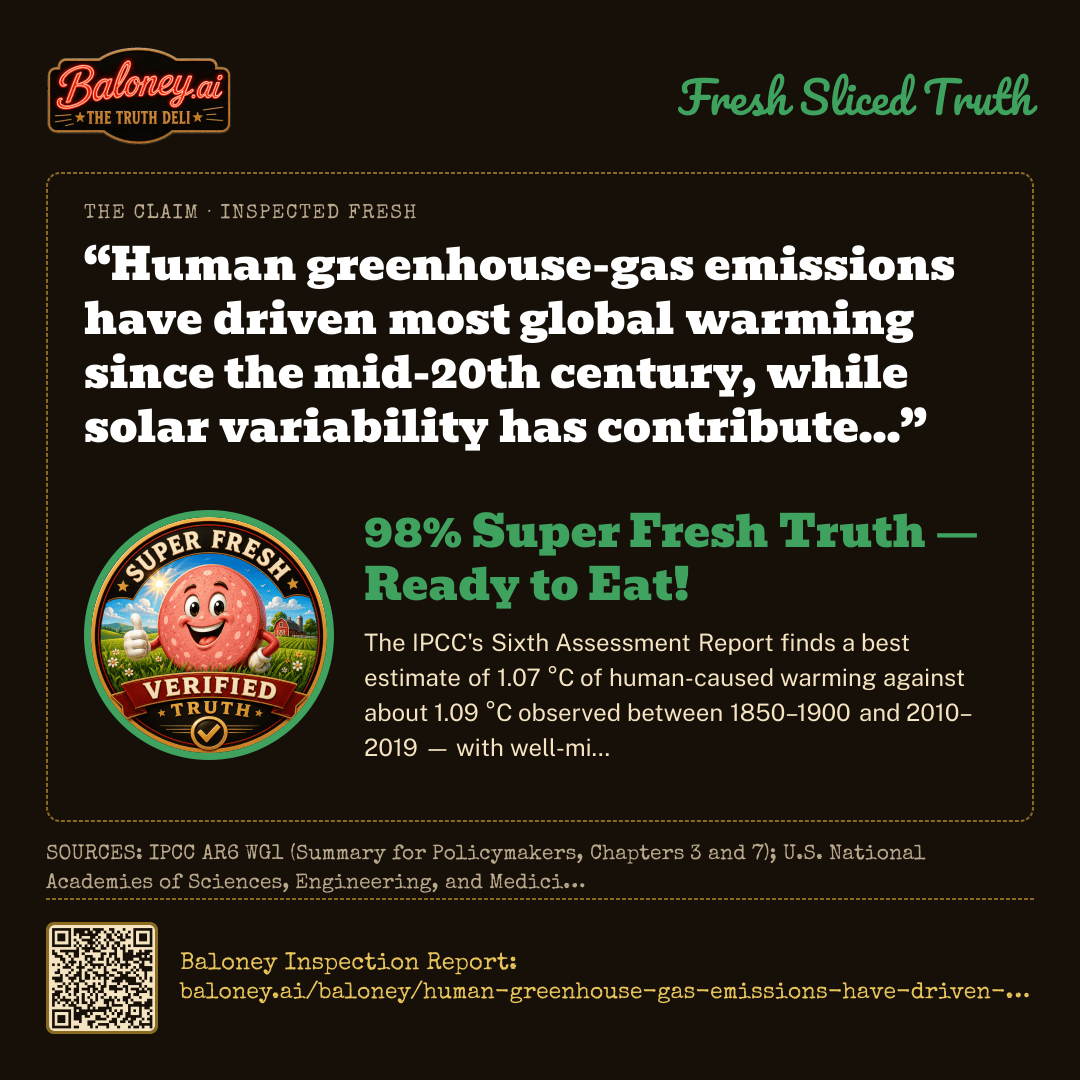
“Human greenhouse-gas emissions have driven most global warming since the mid-20th century, while solar variability has contributed only a small amount.”
98%Super Fresh Truth — Ready to Eat!
THE CLAIM CHECKS OUT.
Independently verifiedPhysically repeatable evidenceConfirmed across rival labsSafe to serve
“Human greenhouse-gas emissions have driven most global warming since the mid-20th century, while solar variability has contributed only a small amount.”98% Super Fresh Truth — Ready to Eat!Verified blind by 5 frontier AIs · Baloney Inspection Report: baloney.ai/baloney/human-greenhouse-gas-emissions-have-driven-most-global
The Rating Card
The claim this refutes
The Baloney Sampler
The claim holds up on four independent lines of evidence. The IPCC's Sixth Assessment Report attributes essentially all observed warming since 1850–1900 to human influence, with greenhouse gases contributing roughly 1.0–2.0 °C and solar plus volcanic drivers only about −0.1 to +0.1 °C — figures echoed by the Congressional Research Service. NASA reports that satellite measurements of the Sun's output since the late 1970s show no net rise, while surface temperatures climbed about 0.2 °C per decade.
Model experiments cited by NASA reproduce the record with natural drivers alone only until about 1950, then diverge until human emissions are included. The observed pattern — a warming surface and troposphere with a cooling stratosphere — is what greenhouse gases predict and the reverse of what a brighter Sun would do. The National Academies reach the same conclusion. The panel's only caveats are wording: 'most' understates the assessed human share, and greenhouse gases are one part of a wider human forcing package.
Other ways to slice it — phrasings that might have changed the rating
“Human greenhouse-gas emissions have driven most global warming since 1750, while solar variability has contributed only a small amount.” Reports note that some pre-satellite irradiance reconstructions imply a larger solar increase in the early 20th century, so the solar share over the full industrial period is less trivial than it is after 1950.
“Human activity has caused essentially 100% of global warming since 1950, with natural factors contributing near zero or slightly negative.” The panel observed that 'most' is an understatement, citing attribution ranges of 93–123% for 1951–2010 human contribution and analyses finding humans account for roughly all post-1950 warming.
“Solar variability, through its effect on cosmic rays and cloud formation, is the dominant driver of global warming since the mid-20th century.” The reports describe this cosmic-ray/cloud hypothesis as a minority position that has not held up in CERN CLOUD experiments or observational cloud records and is not adopted by the assessment literature.
Written from the panel’s reports by Anthropic · claude-opus-5. Nothing here changed the score.
04:35:42SCORING MODEL V2 — MEDIAN OF 5 COUNTED LAB SCORES: 2, 2, 2, 3, 3 → 2. FRESH RULE: THE PRIMARY MASTER SCORES 2 AND THE BLIND MASTER 2 — BOTH SUPER FRESH TRUTH — AND THE COUNTED MEDIAN IS 2, ON THE TRUE SIDE. PUBLISHED AS 2, THE MORE CAUTIOUS OF THE TWO MASTERS.✓
04:35:42SOURCE RULE — LABS CITED 33 SOURCES: 0 DISCARDED FOR HAVING NO URL, 3 DISCARDED AS DEAD LINKS (404/410), 7 COULD NOT BE OPENED BY US AND ARE MARKED UNVERIFIED.✓
04:35:42SOURCE RULE — PRIMARY MASTER RULED ON 20 SOURCES: 0 DISCARDED FOR HAVING NO URL, 0 DISCARDED AS DEAD LINKS, 5 MARKED UNVERIFIED, 15 VERIFIED.✓
How This One Was Sliced
Station 1 · Blind Inspection — Five Graders, Zero Peeking
Each lab scored the claim independently, without seeing the others. Open a breakdown for its evidence, its sources, and how sure it was.
Anthropic · EQUAL WEIGHT · 45.1s
claude-opus-5
98%TRUTH
ROUND-1 BREAKDOWN
Evidence offered for the claim
IPCC AR6 WG1 (2021) Summary for Policymakers concludes it is 'unequivocal that human influence has warmed the atmosphere, ocean and land,' and attributes a best estimate of 1.07 °C of the ~1.09 °C of observed warming (1850–1900 to 2010–2019) to human-caused greenhouse gases plus aerosols — i.e., essentially all of it, which comfortably satisfies 'most'.
IPCC AR6 gives the best estimate of solar and volcanic (natural) forcing contribution to 1850–2019 surface warming as about -0.1 to +0.1 °C — effectively negligible compared with ~1.0–2.0 °C of warming from well-mixed greenhouse gases (partly offset by aerosol cooling).
Direct satellite measurements of total solar irradiance since 1978 show a flat-to-slightly-declining trend across solar cycles, while global surface temperature rose roughly 0.2 °C per decade — the two have diverged for over four decades, ruling out the Sun as the dominant driver of recent warming.
Fingerprint evidence is inconsistent with solar forcing and consistent with greenhouse forcing: the stratosphere has cooled while the troposphere and surface warmed, nights have warmed faster than days, and winters faster than summers. Increased solar output would warm the stratosphere as well.
Radiative-transfer physics plus measured CO2 rise (~280 ppm pre-industrial to >420 ppm today) yields a forcing of roughly 2.2 W/m² from CO2 alone, versus ~0.0–0.1 W/m² from solar changes since 1750 (IPCC AR6 Chapter 7). Satellite spectroscopy has directly measured the increase in downward longwave radiation at CO2 and CH4 wavelengths.
Isotopic (declining 13C/12C and 14C ratios) and oxygen-depletion evidence confirms the atmospheric CO2 increase is from fossil fuel combustion, tying the forcing unambiguously to human emissions.
Independent national and international assessments converge: the U.S. Fourth National Climate Assessment / Climate Science Special Report states there is 'no convincing alternative explanation' and that human activities caused the 'substantial majority' (likely 93–123%) of observed 1951–2010 warming; the Royal Society–U.S. National Academy of Sciences joint report reaches the same conclusion.
Carbon Brief's review of multiple independent attribution studies finds human forcings account for ~100% (and in several analyses slightly more than 100%, offset by natural cooling factors) of observed warming since 1950.
Evidence against the claim
The word 'most' is technically an understatement rather than an error: the mainstream estimate is that humans caused essentially 100% of post-1950 warming, with natural factors near zero or slightly negative. A pedant could call 'most' imprecise, but it is not false.
Attribution carries real uncertainty, dominated by poorly constrained aerosol cooling (AR6 best estimate about -1.1 W/m², with a wide range) and by estimates of internal variability (e.g., Atlantic and Pacific multidecadal variability), which some researchers argue could account for a modest fraction of multidecadal trends.
Reconstructions of pre-satellite solar irradiance differ: some older reconstructions imply a larger solar increase over the early 20th century, so the solar share of warming before ~1950 is larger than it is after 1950. The claim is correctly limited to the mid-20th century onward, but solar forcing is not trivial over the full industrial period.
A minority of researchers (e.g., Svensmark and colleagues on cosmic-ray/cloud coupling, or Scafetta's solar-cycle analyses) argue for amplified indirect solar effects. These mechanisms have not held up in CERN CLOUD experiments or in observational cloud records and are rejected by the assessment literature, but they are a nonzero dissenting line of work.
'Greenhouse-gas emissions' is a slight simplification: human-caused warming also includes land-use change and black carbon, and is partly masked by human-caused aerosol cooling, so the net human contribution involves several forcings rather than greenhouse gases alone.
How sure this lab was
97/100 — the lab’s own confidence in the score above, not a second reading of the claim.
IPCC AR6 finds it is unequivocal that human influence has warmed the climate system and estimates that greenhouse gases caused substantial warming, while aerosols offset some of it; the assessed contribution from solar and volcanic drivers to 2010-2019 warming relative to 1850-1900 is near zero, with a small uncertainty range.
Satellite-era solar observations show no sustained upward trend in the Sun's energy output since the late 1970s, while global surface temperature has continued to rise sharply; this timing supports greenhouse gases rather than solar variability as the dominant driver.
Attribution studies using observations and climate models find that greenhouse gases account for most or more than all of the observed warming since the mid-20th century, with human aerosol pollution masking part of that warming and natural forcings, including solar, contributing little.
The vertical pattern of warming also supports greenhouse forcing: the lower atmosphere and surface have warmed while the stratosphere has cooled, a fingerprint expected from greenhouse-gas increases and not from a brighter Sun.
Evidence against the claim
Solar variability is not literally zero: the 11-year solar cycle and longer-term changes can produce small climate effects, especially on short timescales or regionally, so the claim is strongest when interpreted as global, multi-decadal warming since the mid-20th century.
Attribution has uncertainty because aerosols, volcanic eruptions, ocean variability, and measurement differences complicate the exact partition of warming. However, those uncertainties do not overturn the conclusion that greenhouse gases dominate and solar variability is small.
Some researchers have proposed larger solar contributions, especially for earlier 20th-century warming, but these claims are not the mainstream assessment for warming since the mid-20th century and are outweighed by IPCC assessments, satellite solar records, and detection-attribution studies.
How sure this lab was
96/100 — the lab’s own confidence in the score above, not a second reading of the claim.
The Intergovernmental Panel on Climate Change (IPCC) Sixth Assessment Report (AR6) states that it is 'unequivocal that human influence has warmed the atmosphere, ocean and land,' identifying human-emitted greenhouse gases as the primary driver of global warming since the mid-20th century.
NASA and the Royal Society report that satellite measurements since the late 1970s show no net increase in the Sun's energy output. In fact, solar irradiance has slightly declined over the last few decades, a period that coincides with the most rapid increase in global temperatures.
Comparisons of radiative forcing (the difference between incoming and outgoing energy in the Earth's system) show that the warming effect of human-produced greenhouse gases is magnitudes larger than the negligible influence of variations in solar irradiance since 1750.
Evidence against the claim
A small minority of researchers (such as Henrik Svensmark) have proposed the 'cosmic ray hypothesis,' suggesting that solar variability indirectly affects the climate by modulating galactic cosmic rays, which could theoretically influence cloud formation and reflect sunlight.
A handful of contrarian studies published outside the mainstream consensus argue for higher solar climate sensitivity, asserting that natural cycles play a larger role. However, these hypotheses have been repeatedly tested and largely dismissed by the broader scientific community because they cannot account for the observed rapid warming and atmospheric patterns (like stratospheric cooling) seen over the past 70 years.
How sure this lab was
99/100 — the lab’s own confidence in the score above, not a second reading of the claim.
IPCC Sixth Assessment findings summarized by the U.S. Congressional Research Service estimate that well-mixed human greenhouse gases contributed 1.0–2.0°C of warming, while natural drivers contributed only −0.1 to +0.1°C over the relevant period. This supports the wording “most global warming.”[https://www.congress.gov/crs_external_products/R/PDF/R47082/R47082.3.pdf]
NASA reports that climate simulations including only solar variability and volcanic aerosols reproduce observed temperatures only until about 1950; thereafter they cannot reproduce the warming without human greenhouse-gas increases.[https://science.nasa.gov/earth/climate-change/global-warming/]
NASA states that solar energy received by Earth has shown no net increase since the 1950s while global temperature has risen substantially, and that observed surface warming combined with stratospheric cooling is inconsistent with increased solar output as the main cause.[https://science.nasa.gov/climate-change/faq/is-the-sun-causing-global-warming/]
The National Academies conclude that rigorous analysis shows most observed global warming over roughly the past 50 years cannot be explained by natural causes and requires a significant human influence.[https://nap.nationalacademies.org/read/25733/chapter/5]
The National Academies report that recent solar forcing is estimated at about +0.01 W/m², roughly 300 times smaller than anthropogenic forcing.[https://www.nationalacademies.org/read/29239/chapter/4]
Evidence against the claim
Solar variability is a real climate influence and can affect temperatures from decade to decade; therefore “only a small amount” should not be interpreted as zero contribution.[https://science.nasa.gov/earth/climate-change/global-warming/]
The statement does not specify a quantitative period or warming metric. Attribution estimates vary somewhat depending on whether the comparison begins in the mid-20th century, uses surface temperature or another metric, and accounts for aerosols and internal variability.[https://www.congress.gov/crs_external_products/R/PDF/R47082/R47082.3.pdf]
Human greenhouse gases are not the only human climate influence: anthropogenic aerosols have exerted a substantial cooling effect, so the claim is accurate about the dominant driver but simplifies the full human attribution of observed warming.[https://www.congress.gov/crs_external_products/R/PDF/R47082/R47082.3.pdf]
How sure this lab was
98/100 — the lab’s own confidence in the score above, not a second reading of the claim.
IPCC AR6 finds it unequivocal that human influence warmed the climate system; well-mixed greenhouse gases are the dominant driver of the observed rise since the mid-20th century, with best-estimate human-caused warming (~1.07°C from 1850–1900 to 2010–2019) matching observed warming.
Satellite total solar irradiance records since 1978 show no rising trend; solar output has been flat to slightly declining while surface temperatures rose sharply.
CMIP detection-and-attribution experiments: natural-only (solar + volcanic) simulations do not reproduce post-1950 warming; adding anthropogenic GHG (and aerosol) forcings does.
Observed vertical fingerprint—tropospheric warming plus stratospheric cooling—matches greenhouse-gas forcing and is inconsistent with increased solar output, which would warm the stratosphere.
AR6 effective radiative forcing from anthropogenic well-mixed GHGs far exceeds estimated solar ERF (near zero over 1750–2019, and not positive since the mid-20th century).
Evidence against the claim
A minority of TSI reconstructions that imply a larger secular 20th-century solar increase have been used to argue solar variability explains more of the early- and mid-century warming (though they do not account for post-1980 warming under declining or flat TSI).
Residual uncertainty in aerosol cooling and internal variability (e.g., Atlantic Multidecadal Oscillation) means the exact GHG share has a range, so a few papers assign a larger natural fraction to recent decades.
Unconfirmed amplifying mechanisms (cosmic-ray/cloud hypotheses) have been proposed; they remain unsupported by the bulk of observational and experimental evidence (including CERN CLOUD results) and are not adopted in IPCC assessments.
How sure this lab was
92/100 — the lab’s own confidence in the score above, not a second reading of the claim.
All five evaluators independently reached the same conclusion with high confidence (recommended scores 2, 2, 3, 3, 2; confidence 92–99), and their evidence converges on the same four independent lines: (1) IPCC AR6's formal attribution, which assigns essentially all of the ~1.09 °C of observed warming (1850–1900 to 2010–2019) to human influence, with well-mixed greenhouse gases contributing roughly 1.0–2.0 °C partly offset by aerosol cooling, and solar plus volcanic forcing contributing only about −0.1 to +0.1 °C; (2) direct satellite measurement of total solar irradiance since 1978 showing a flat-to-slightly-declining trend while surface temperature rose roughly 0.2 °C per decade; (3) detection-and-attribution modelling in which natural-only simulations track observations until about 1950 and then diverge, while runs including anthropogenic forcing reproduce the observed record; and (4) the vertical fingerprint — a warming troposphere and surface with a cooling stratosphere — which is what greenhouse forcing predicts and the opposite of what a brighter Sun would produce. I weighted the primary assessment literature (IPCC AR6, National Academies, USGCRP, Royal Society, Met Office, NOAA, NASA) most heavily because it is consensus-synthesised and independently replicated across national bodies. The dissenting material the panel surfaced — cosmic-ray/cloud hypotheses and high-solar-sensitivity reconstructions — was examined and found not to survive CERN CLOUD results or the post-1980 divergence between solar output and temperature. The only genuine caveats are wording-level: 'most' is in fact an understatement (mainstream estimates run to ~100% of post-1950 warming), and 'greenhouse-gas emissions' slightly simplifies a human forcing package that also includes land-use change, black carbon and offsetting aerosol cooling. Neither caveat makes any part of the statement false, so it sits at the very fresh end of the scale rather than merely inside it. I settled on 2 rather than 3 because the two numerical qualifiers in the claim ('most' and 'only a small amount') are both conservative relative to the assessed figures.
Unanimous on substance: all five evaluators judged the claim true and placed it in the Super Fresh Truth band, differing only between 2 and 3. All five cited IPCC AR6 and the flat satellite solar-irradiance record; four of five independently raised the stratospheric-cooling fingerprint. The only disagreement was about how much weight to give wording imprecision — Reports 3 and 4 nudged to 3 because the claim omits aerosols and other non-greenhouse human forcings and does not specify a metric or baseline, while Reports 1, 2 and 5 held at 2 on the grounds that 'most' understates rather than overstates the evidence. No evaluator identified any factual error, and all five independently examined and rejected the solar-amplification counter-hypotheses.
SUPER FRESH — VERIFIED AGAINST IPCC AR6 WG1 (SUMMARY FOR POLICYMAKERS, CHAPTERS 3 AND 7); U.S. NATIONAL ACADEMIES OF SCIENCES, ENGINEERING, AND MEDICINE; NASA SCIENCE; NOAA CLIMATE.GOV; U.S. GLOBAL CHANGE RESEARCH PROGRAM (NCA4 AND NCA2023); ROYAL SOCIETY & U.S. NATIONAL ACADEMY OF SCIENCES; UK MET OFFICE; CONGRESSIONAL RESEARCH SERVICE.
Blind Validation Master · never saw the Primary’s work
gemini-3.1-pro-preview
98% TRUTH
The claim accurately represents the overwhelming scientific consensus documented by the IPCC, NASA, the National Academies of Sciences, and the Royal Society. Observational data and climate models confirm that human-caused greenhouse gas emissions are responsible for virtually all of the global warming observed since the mid-20th century. During this same period, satellite measurements show that solar energy output has not increased, and natural drivers like solar variability have contributed a negligible amount to global temperatures. Atmospheric 'fingerprints,' such as tropospheric warming paired with stratospheric cooling, further confirm greenhouse gases as the dominant driver, ruling out solar variability.
AGREEMENT TEST PASSED — BOTH MASTERS SCORED 98% · BLIND VALIDATION CONFIRMED THIS SCORE · NO RE-EVALUATION REQUIRED
Median of 5 counted lab scores: 2, 2, 2, 3, 3 → 2.
Fresh rule: the Primary Master scores 2 and the Blind Master 2 — both Super Fresh Truth — and the counted median is 2, on the true side. Published as 2, the more cautious of the two masters.
The Evidence
Evidence for the claim
IPCC AR6 attribution is unequivocal The Sixth Assessment Report states it is 'unequivocal that human influence has warmed the atmosphere, ocean and land', with a best estimate of 1.07 °C of human-caused warming against ~1.09 °C observed from 1850–1900 to 2010–2019 — essentially all of it.
Natural forcing contribution is near zero AR6 puts the combined solar and volcanic contribution to observed warming at about −0.1 to +0.1 °C, against 1.0–2.0 °C from well-mixed greenhouse gases partly offset by aerosol cooling. The National Academies estimate recent solar forcing at roughly +0.01 W/m², around 300 times smaller than anthropogenic forcing.
Satellite solar records show no upward trend Direct measurements of total solar irradiance since 1978 show a flat-to-slightly-declining trend across solar cycles, while global surface temperature rose roughly 0.2 °C per decade — the two have diverged for over four decades.
Natural-only models fail after 1950 CMIP detection-and-attribution experiments driven by solar and volcanic forcing alone track observed temperatures until about 1950 and then diverge; adding anthropogenic greenhouse gases and aerosols reproduces the observed record.
The vertical fingerprint rules out the Sun The troposphere and surface have warmed while the stratosphere has cooled, nights have warmed faster than days and winters faster than summers. A brighter Sun would warm the stratosphere too; this pattern is the signature of greenhouse forcing.
Independent national assessments converge The USGCRP Climate Science Special Report finds there is 'no convincing alternative explanation' and attributes the substantial majority (likely 93–123%) of 1951–2010 warming to human activity; the Royal Society and US National Academy of Sciences reach the same conclusion.
The carbon is traceably fossil Declining 13C/12C and 14C ratios in atmospheric CO2, together with atmospheric oxygen depletion, identify fossil fuel combustion as the source of the rise from ~280 ppm pre-industrial to over 420 ppm, tying the forcing unambiguously to human emissions.
Evidence offered against the claim
Solar influence is small, not zero The 11-year solar cycle and longer-term variations do produce measurable climate effects, particularly on short timescales and regionally. 'Only a small amount' should be read as small, not as literally nothing.
'Greenhouse gases' simplifies the human package Human warming also includes land-use change and black carbon, and is partly masked by human aerosol cooling estimated at about −1.1 W/m². The claim names the dominant driver correctly but compresses several forcings into one.
'Most' understates the assessed figure The mainstream estimate is that humans caused essentially 100% of post-1950 warming, with natural factors near zero or slightly negative. 'Most' is a conservative wording rather than an error.
Attribution carries real uncertainty Poorly constrained aerosol cooling, volcanic eruptions, internal variability such as Atlantic and Pacific multidecadal oscillations, and differences between temperature datasets mean the exact greenhouse-gas share spans a range — though none of this overturns the dominance conclusion.
Minority solar hypotheses exist Svensmark's cosmic-ray/cloud coupling and Scafetta's solar-cycle analyses argue for amplified indirect solar effects, and some older irradiance reconstructions imply a larger solar role in early-20th-century warming. These have not held up in CERN CLOUD experiments or observational cloud records, and cannot explain warming after 1980 under flat or declining solar output.
Sources · Reliability · Why Accepted or Discounted
ACCEPTED — The definitive multi-government scientific synthesis on attribution; cited independently by all five evaluators and the direct source of the quantitative figures.
ACCEPTED — Non-partisan legislative research summary of AR6; the source of the 1.0–2.0 °C greenhouse-gas versus −0.1 to +0.1 °C natural figures, and also the source of the panel's fairest caveats.
ACCEPTED — Peer-reviewed primary literature supporting the detection-and-attribution partition.
Every link was opened when this claim was inspected. A dead link was discarded before publication; “unverified” means the site refused our automated check and the link is the one the panel cited. A source without a URL was never kept.
“Human greenhouse-gas emissions have driven most global warming since the mid-20th century, while solar variability has contributed only a small amount.”98% Super Fresh Truth — Ready to Eat!Verified blind by 5 frontier AIs · Baloney Inspection Report: baloney.ai/baloney/human-greenhouse-gas-emissions-have-driven-most-global
Support The Truth Deli
Buy The Truth Deli Merch
“Democracy Makes America Great”
Veritate Libertas — Latin for “Through Truth, Liberty.”
Democracy is what makes America great. But without truth — honest, real, scientifically validated truth — democracy fails. The baloney slicer is on: feeding fresh sliced truth to protect what makes America great. Democracy.