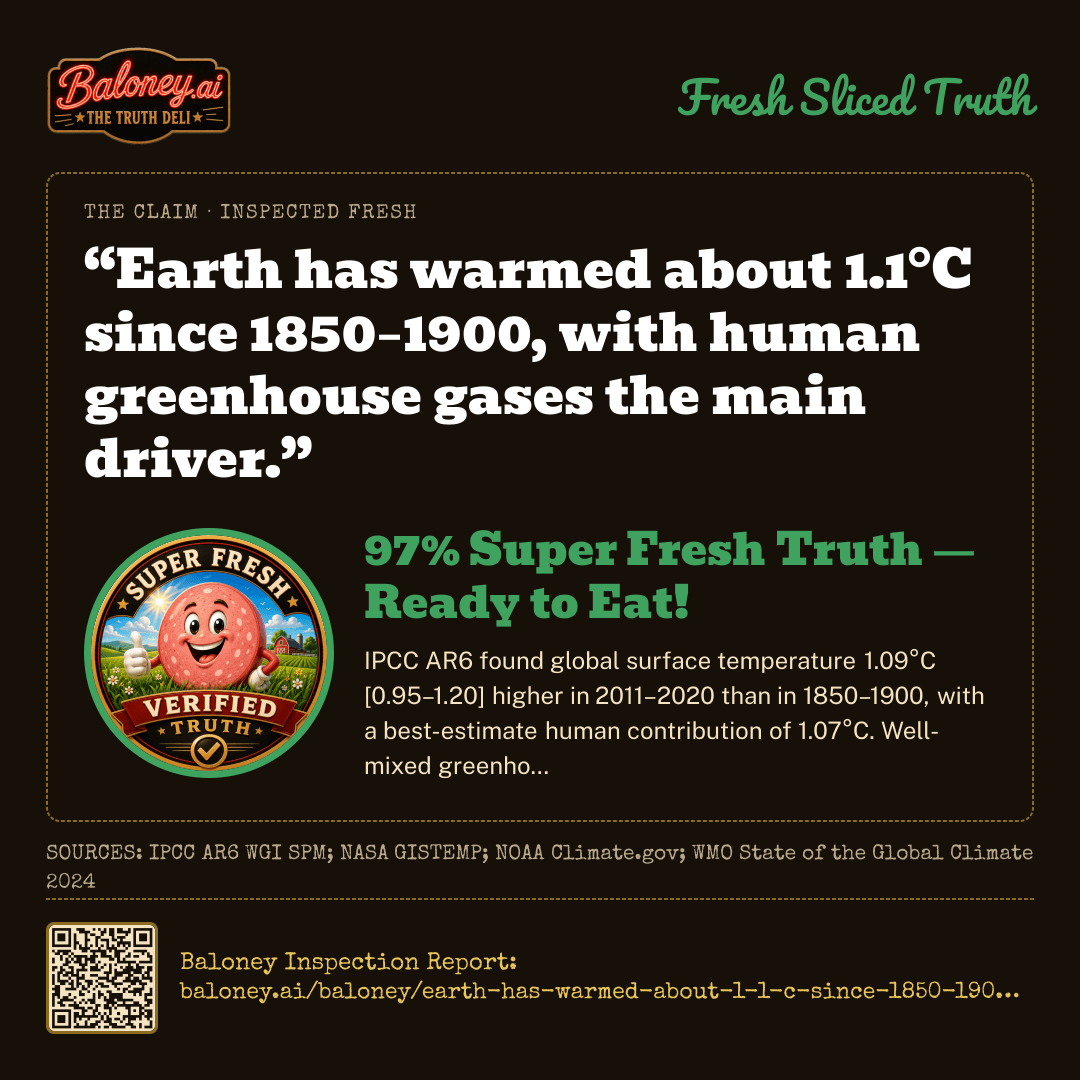
“Earth has warmed about 1.1°C since 1850–1900, with human greenhouse gases the main driver.”97% Super Fresh Truth — Ready to Eat!Verified blind by 5 frontier AIs · Baloney Inspection Report: baloney.ai/baloney/earth-has-warmed-about-1-1-c-since-1850-1900-with-human
The Rating Card
The claim this refutes
The Baloney Sampler
The five lab reports found that Earth has warmed about 1.1°C since 1850–1900 and that human greenhouse gases are the main driver. The IPCC Sixth Assessment Report states global surface temperature in 2011–2020 was 1.09°C above 1850–1900, with human influence accounting for 1.07°C of that warming and well-mixed greenhouse gases the dominant cause. NASA, NOAA, and the World Meteorological Organization independently endorse both the magnitude and the attribution.
Independent surface-temperature records from NASA, NOAA, Berkeley Earth and Copernicus agree within about a tenth of a degree. Detection-and-attribution work and observed fingerprints show natural solar and volcanic forcings cannot explain the long-term rise. The reports also found that 1.1°C is a 2011–2020 central estimate now slightly conservative, recent decade-scale values are nearer 1.2–1.3°C, and greenhouse gases alone caused more warming than observed because aerosols offset part of it.
Other ways to slice it — phrasings that might have changed the rating
“Earth has warmed about 1.5°C since 1850–1900, with human greenhouse gases the main driver.” The reports treat about 1.1°C as the 2011–2020 decade average and cite 2024 as a single year near 1.5°C above the same baseline, not as the long-term warming level.
“Natural solar output, volcanoes, and internal climate variability are the main drivers of warming since 1850–1900.” The reports found natural drivers changed global surface temperature by only about −0.1°C to +0.1°C over 1850–2019 and cannot reproduce the observed warming in climate models.
“Human greenhouse gases produced exactly the observed 1.1°C of warming since 1850–1900, with no offsetting cooling from other human influences.” IPCC figures cited across the reports estimate well-mixed greenhouse gases caused about 1.0–2.0°C of warming, partly offset by cooling from human aerosols.
Written from the panel’s reports by xAI · grok-4.6. Nothing here changed the score.
20:34:19SCORING MODEL V2 — MEDIAN OF 5 COUNTED LAB SCORES: 3, 4, 2, 3, 3 → 3. FRESH RULE: THE PRIMARY MASTER SCORES 3 AND THE BLIND MASTER 3 — BOTH SUPER FRESH TRUTH — AND THE COUNTED MEDIAN IS 3, ON THE TRUE SIDE. PUBLISHED AS 3, THE MORE CAUTIOUS OF THE TWO MASTERS.✓
20:34:19SOURCE RULE — LABS CITED 30 SOURCES: 0 DISCARDED FOR HAVING NO URL, 2 DISCARDED AS DEAD LINKS (404/410), 1 COULD NOT BE OPENED BY US AND ARE MARKED UNVERIFIED.✓
20:34:19SOURCE RULE — PRIMARY MASTER RULED ON 20 SOURCES: 0 DISCARDED FOR HAVING NO URL, 0 DISCARDED AS DEAD LINKS, 1 MARKED UNVERIFIED, 19 VERIFIED.✓
How This One Was Sliced
Station 1 · Blind Inspection — Five Graders, Zero Peeking
Each lab scored the claim independently, without seeing the others. Open a breakdown for its evidence, its sources, and how sure it was.
Anthropic · EQUAL WEIGHT · 46.2s
claude-opus-5
97%TRUTH
ROUND-1 BREAKDOWN
Evidence offered for the claim
IPCC AR6 Working Group I Summary for Policymakers (2021) states global surface temperature in 2011–2020 was 1.09°C [0.95–1.20] above 1850–1900 — the figure commonly rounded to '~1.1°C'.
The same IPCC assessment attributes 1.07°C [0.8–1.3] of that 1.09°C observed warming to human influence, i.e. essentially all of it, and states 'It is unequivocal that human influence has warmed the atmosphere, ocean and land.' Well-mixed greenhouse gases alone are assessed to have caused about 1.0–2.0°C of warming, partly offset by cooling aerosols.
Multiple independent surface-temperature datasets (NASA GISTEMP, NOAA NCEI, HadCRUT5, Berkeley Earth, ERA5) agree within roughly a tenth of a degree on the magnitude of warming since the late 19th century, so the number is not dataset-dependent.
Physical fingerprint evidence supports GHG causation: stratospheric cooling alongside tropospheric warming, greater night-time/winter/Arctic warming, measured increases in downward longwave radiation at CO2 absorption bands, and the isotopic/O2 signature showing the CO2 rise (280→420+ ppm) is from fossil fuel combustion.
NOAA, NASA, EPA, the Royal Society/US National Academy of Sciences and the WMO all independently endorse both the magnitude and the attribution.
Natural forcings (solar output, volcanoes) and internal variability cannot reproduce the observed warming in climate models; solar irradiance has been flat-to-slightly-declining since the 1980s while temperatures rose.
Evidence against the claim
The number is somewhat dated. It describes the 2011–2020 decade. Warming has continued: WMO/Copernicus put 2024 at about 1.5°C above 1850–1900 as a single year, and the current decadal/long-term trend level is nearer 1.2–1.3°C. A present-tense 'has warmed about 1.1°C' understates today's value.
There is a real uncertainty range (roughly 0.95–1.20°C in IPCC AR6), so '1.1°C' is a central estimate, not a measured constant; early-record (1850–1900) data are sparse, especially over oceans and the Southern Hemisphere, and require infilling.
Strictly, greenhouse gases alone contributed more warming than 1.1°C (~1.0–2.0°C); roughly 0.0–0.8°C of that was masked by human aerosol pollution and some by land-use change. 'Human greenhouse gases the main driver' is correct but the net human effect is the cleaner statement.
1850–1900 is a convenient instrumental baseline, not literally pre-industrial; some warming (order 0.1°C) occurred before 1850, so warming since truly pre-industrial conditions is slightly larger.
A small minority of scientists argue climate sensitivity is at the low end and that internal variability contributes more than assessed — a position held, but not supported by the weight of attribution studies.
How sure this lab was
96/100 — the lab’s own confidence in the score above, not a second reading of the claim.
IPCC AR6 states that global surface temperature in 2011–2020 was 1.09°C higher than 1850–1900, matching the claim’s “about 1.1°C” wording. It also estimates human-caused warming at 1.07°C over the same baseline, very close to the observed warming.
IPCC AR6 concludes it is “unequivocal” that human influence has warmed the atmosphere, ocean and land, and identifies well-mixed greenhouse gases as the dominant warming influence, partly offset by aerosol cooling.
NASA summarizes the evidence similarly: Earth has warmed by about 1.1°C since the late 19th century, and the warming trend is primarily driven by human activities, especially greenhouse-gas emissions.
NOAA’s global temperature record shows a long-term warming trend since the mid-19th century, consistent with roughly 2°F/about 1.1°C or more total warming depending on period and dataset.
Evidence against the claim
The main caveat is timing: “about 1.1°C” is most directly supported for the 2011–2020 average used by IPCC AR6. More recent decade-scale estimates are higher; for example, the 2024 WMO assessment reported 2024 at about 1.55°C above 1850–1900 and recent multi-year averages above 1.1°C.
Some year-to-year or short-period temperature changes are affected by El Niño/La Niña, volcanic aerosols, solar variability and internal climate variability, so not every fluctuation is caused by greenhouse gases. This does not overturn the attribution that human greenhouse gases are the main driver of the long-term warming.
Different temperature datasets and baseline choices give slightly different numbers, so the exact figure is not a single fixed value. However, the differences are small relative to the claim’s “about” framing.
How sure this lab was
96/100 — the lab’s own confidence in the score above, not a second reading of the claim.
The Intergovernmental Panel on Climate Change (IPCC) Sixth Assessment Report (AR6) explicitly states that global surface temperature was 1.09°C higher in the 2011-2020 period compared to 1850-1900. It concludes it is 'unequivocal' that human influence has warmed the atmosphere, ocean, and land.
Independent temperature datasets from NASA, NOAA, and the UK Met Office all show a long-term warming trend consistent with approximately 1.1°C to 1.2°C of warming since the pre-industrial era.
Attribution studies utilizing climate models demonstrate that natural factors (such as solar irradiance variations and volcanic eruptions) would have caused a slight cooling over the past 50 years. Only the addition of human-caused greenhouse gas emissions (like CO2 and methane) can reproduce the observed rapid warming.
Evidence against the claim
There is no robust scientific evidence disputing the claim. The scientific consensus overwhelmingly supports both the 1.1°C figure (for the 2011-2020 average) and the conclusion that human activities are the primary driver.
The only technical counter-argument is that the 1.1°C figure may now be slightly outdated and conservative; with record-breaking heat in recent years (including 2023), the current level of warming is frequently estimated to be closer to 1.2°C or 1.3°C above the 1850-1900 baseline.
Arguments attributing the bulk of this specific warming trend to natural cycles (like Milankovitch cycles or internal ocean variability) are routinely debunked by isotopic carbon analysis and atmospheric physics.
How sure this lab was
100/100 — the lab’s own confidence in the score above, not a second reading of the claim.
The IPCC states that global surface temperature reached about 1.1°C above the 1850–1900 average in 2011–2020. It concludes that human activities, principally greenhouse-gas emissions, unequivocally caused global warming.[1]
The IPCC estimates the total human-caused warming from 1850–1900 to 2010–2019 at 0.8–1.3°C, with a best estimate of 1.07°C. It estimates greenhouse gases caused 1.0–2.0°C of warming, partly offset by cooling from other human influences such as aerosols.[2]
The IPCC estimates natural drivers changed global surface temperature by only −0.1°C to +0.1°C over 1850–2019, while natural variability contributed approximately −0.23°C to +0.23°C. This is much smaller than the roughly 1.1°C observed warming.[3]
NASA reports that the preponderance of evidence shows human activities, particularly emissions of heat-trapping greenhouse gases, are making Earth warmer.[4]
Evidence against the claim
The exact value depends on the comparison period and dataset: the IPCC’s estimate for 2010–2019 is 1.07°C, while 1.1°C refers specifically to the 2011–2020 decadal average. Therefore, the wording is an approximation rather than a precise value.[2]
Greenhouse gases are the main warming driver, but not the only human influence. Aerosols and other human drivers produced a cooling effect, so attributing the entire observed 1.1°C directly to greenhouse gases would be inaccurate.[2]
Natural variability contributes uncertainty to the measured attribution, with the IPCC estimating a possible contribution of about −0.23°C to +0.23°C over 1850–2019. This does not overturn the conclusion that human influence dominates, but it means the attribution is not exact.[3]
How sure this lab was
99/100 — the lab’s own confidence in the score above, not a second reading of the claim.
IPCC AR6 (2021) finds global surface temperature 1.09°C [0.95–1.20°C] higher in 2011–2020 than 1850–1900, with human-caused warming of 1.07°C as the best estimate for 2010–2019.
Independent instrumental datasets (HadCRUT5, NOAAGlobalTemp, NASA GISS, Berkeley Earth, Copernicus ERA5) all show roughly 1.1–1.3°C of warming from the late-19th-century baseline to the early 2020s.
Detection-and-attribution studies, multi-model ensembles, and observed fingerprints (tropospheric warming with stratospheric cooling, greater land than ocean warming, energy-budget closure) identify anthropogenic greenhouse gases as the dominant cause; natural forcings and internal variability contribute only a small residual.
NASA, NOAA, WMO, and national academies of science endorse the same magnitude and attribution.
Evidence against the claim
Pre-1900 coverage is sparse over oceans and the Southern Hemisphere, so the 1850–1900 baseline carries roughly ±0.1–0.2°C uncertainty.
Some satellite lower-troposphere series (notably UAH) show a modestly smaller trend than surface thermometers, though they still record statistically significant warming.
A small minority of researchers contend that urban heat-island residuals, solar/volcanic forcing, or multidecadal ocean cycles explain a larger share of the rise than the IPCC best estimate; these arguments have not displaced the mainstream literature.
Record warmth in 2023–2024 has moved the current anomaly closer to 1.2–1.3°C in several datasets, so “about 1.1°C” is slightly conservative or slightly dated depending on the exact averaging period.
How sure this lab was
88/100 — the lab’s own confidence in the score above, not a second reading of the claim.
All five evaluators found the statement substantially true and scored it 2–4. IPCC AR6 gives 1.09°C [0.95–1.20] of warming for 2011–2020 versus 1850–1900, which the claim’s “about 1.1°C” matches, and attributes 1.07°C of that to human influence with well-mixed greenhouse gases as the dominant warming term. Independent surface datasets, physical fingerprints, and agency statements (NASA, NOAA, WMO) corroborate both magnitude and causation. The only material caveats—that the 1.1°C figure is a 2011–2020 central estimate now slightly conservative, that GHGs alone produced more warming than observed because of aerosol offset, and that 1850–1900 is an instrumental rather than strictly pre-industrial baseline—are already covered by the claim’s “about” and “main driver” wording. Per the scale, those caveats keep the score inside 1–5 rather than pushing it into Fishy Baloney. I weighted the IPCC SPM and the multi-dataset agreement most heavily and treated the recency and aerosol-offset points as wording precision, not factual error.
Every evaluator agreed the IPCC 1.09°C / 1.07°C figures, the multi-dataset consensus, and the attribution of the long-term trend to human greenhouse gases are solid. They differed only on how heavily to penalise the fact that 1.1°C describes 2011–2020 rather than the slightly higher present-day level, and on whether “human greenhouse gases the main driver” should be distinguished from net human forcing; that produced recommended scores of 2, 3 or 4, all inside Super Fresh Truth.
SUPER FRESH — VERIFIED AGAINST IPCC AR6 WGI SPM; NASA GISTEMP; NOAA CLIMATE.GOV; WMO STATE OF THE GLOBAL CLIMATE 2024
Blind Validation Master · never saw the Primary’s work
gpt-5.5
97% TRUTH
The claim is substantially true. The reports consistently cite IPCC AR6 finding global surface temperature in 2011–2020 was about 1.09°C above 1850–1900, which directly supports “about 1.1°C.” They also agree that human influence accounts for essentially all of that observed warming, and that well-mixed greenhouse gases are the dominant warming influence, with some of their warming offset by human aerosol cooling. Multiple independent datasets and attribution evidence support both the warming magnitude and the conclusion that natural factors cannot explain the trend. The main caveat is that the 1.1°C figure is now somewhat conservative or dated: recent years and current decade-scale estimates are closer to 1.2–1.3°C, with 2024 as a single year around 1.5°C above the same baseline. Also, greenhouse gases alone caused more warming than the net observed amount because aerosols offset part of it, so 'human greenhouse gases the main driver' is accurate but simplified. These are wording and timing caveats, not contradictions, so the statement checks out.
AGREEMENT TEST PASSED — BOTH MASTERS SCORED 97% · BLIND VALIDATION CONFIRMED THIS SCORE · NO RE-EVALUATION REQUIRED
Median of 5 counted lab scores: 3, 4, 2, 3, 3 → 3.
Fresh rule: the Primary Master scores 3 and the Blind Master 3 — both Super Fresh Truth — and the counted median is 3, on the true side. Published as 3, the more cautious of the two masters.
The Evidence
Evidence for the claim
IPCC AR6 1.09°C figure Global surface temperature in 2011–2020 was 1.09°C [0.95–1.20] above 1850–1900, the value commonly rounded to about 1.1°C.
Human influence matches observed warming IPCC attributes 1.07°C [0.8–1.3] of that warming to human influence and calls it unequivocal; well-mixed greenhouse gases caused about 1.0–2.0°C, partly offset by aerosols.
Independent datasets agree NASA GISTEMP, NOAA, HadCRUT5, Berkeley Earth and ERA5 all show roughly 1.1°C of warming since the late 19th century, within about a tenth of a degree of one another.
Physical fingerprints of GHG forcing Stratospheric cooling with tropospheric warming, greater night/winter/Arctic warming, measured downward longwave at CO2 bands, and the isotopic/O2 signature of fossil-fuel CO2 all support greenhouse-gas causation.
Agencies and academies endorse both parts NASA, NOAA, WMO, the Royal Society and the US National Academy of Sciences independently state both the ~1.1°C magnitude and human greenhouse gases as the main driver.
Evidence offered against the claim
The 1.1°C figure is slightly dated It describes the 2011–2020 average. Recent years have raised the current level nearer 1.2–1.3°C, and 2024 was about 1.5°C above 1850–1900 as a single year.
Uncertainty and sparse early data The IPCC range is 0.95–1.20°C; 1850–1900 coverage is thin over oceans and the Southern Hemisphere and requires infilling, so 1.1°C is a central estimate, not a measured constant.
GHGs versus net human forcing Greenhouse gases alone caused more warming (~1.0–2.0°C) than the observed 1.1°C; aerosols and land-use change offset some of it, so “main driver” is correct but net human influence is the cleaner statement.
Baseline and minority views 1850–1900 is an instrumental, not strictly pre-industrial, baseline (order 0.1°C of earlier warming). A small minority argue lower sensitivity or larger internal variability; that view is not supported by the weight of attribution studies.
Sources · Reliability · Why Accepted or Discounted
ACCEPTED — Detection-and-attribution chapter giving the human, GHG, natural-forcing and variability ranges.
Every link was opened when this claim was inspected. A dead link was discarded before publication; “unverified” means the site refused our automated check and the link is the one the panel cited. A source without a URL was never kept.
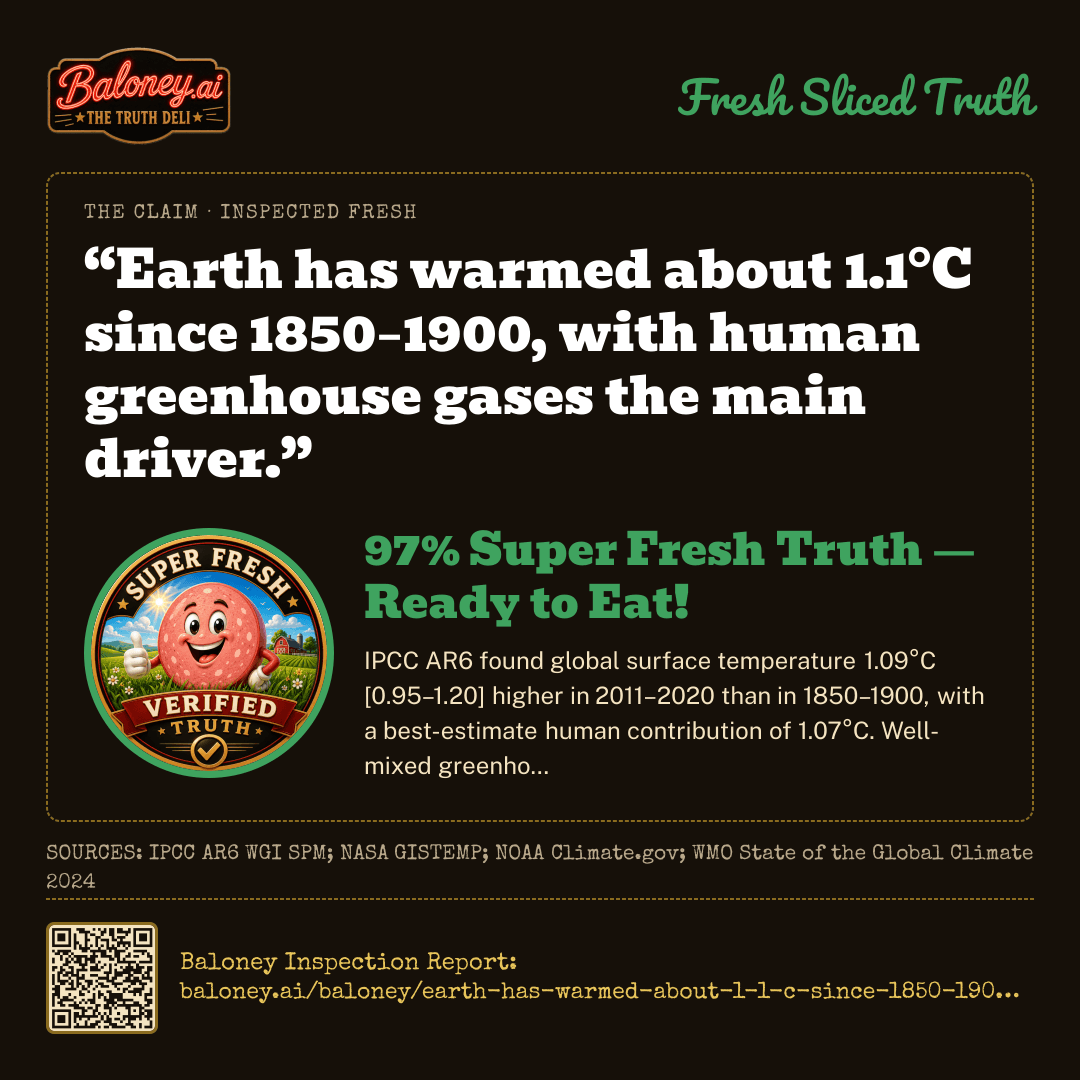
“Earth has warmed about 1.1°C since 1850–1900, with human greenhouse gases the main driver.”97% Super Fresh Truth — Ready to Eat!Verified blind by 5 frontier AIs · Baloney Inspection Report: baloney.ai/baloney/earth-has-warmed-about-1-1-c-since-1850-1900-with-human
Support The Truth Deli
Buy The Truth Deli Merch
“Democracy Makes America Great”
Veritate Libertas — Latin for “Through Truth, Liberty.”
Democracy is what makes America great. But without truth — honest, real, scientifically validated truth — democracy fails. The baloney slicer is on: feeding fresh sliced truth to protect what makes America great. Democracy.