Baloney Inspection Report: Claim #1074 · Inspected Sep 30, 2026, 10:53 AM PDT · Scoring model v2
 45%
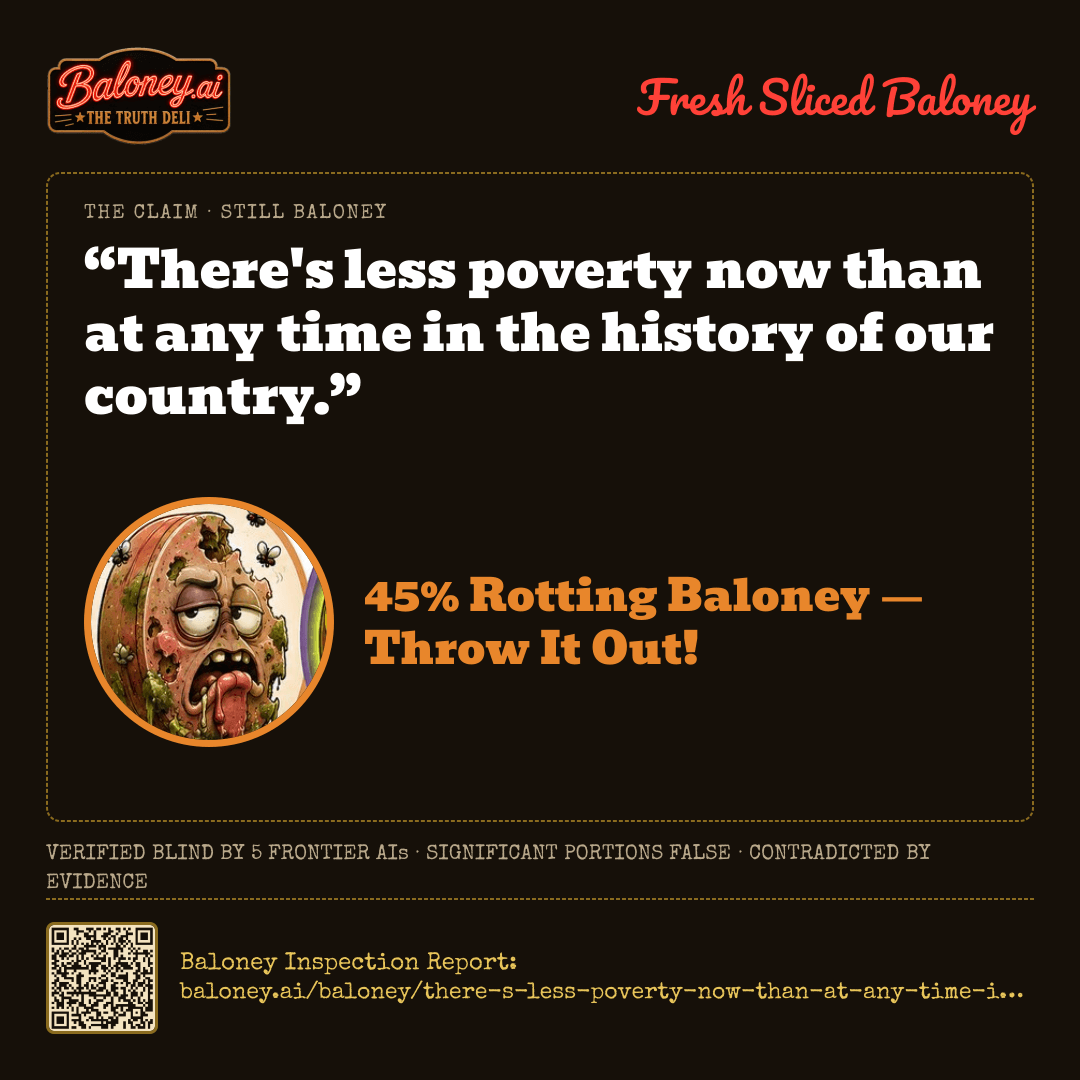
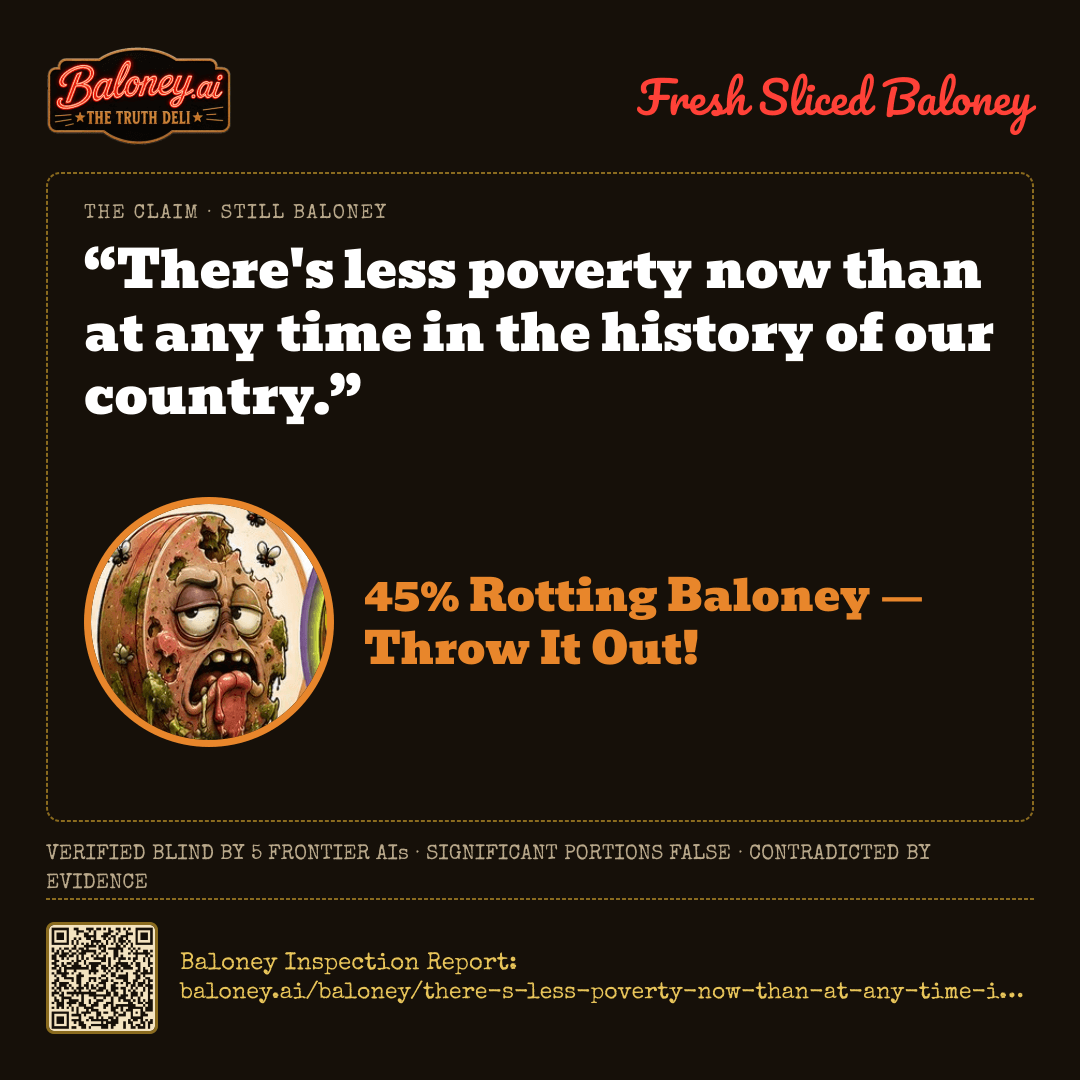
45%“There's less poverty now than at any time in the history of our country.”
45%Rotting Baloney — Throw It Out!
Most of this claim has spoiled.
Significant portions falseContradicted by evidenceUnsupported assertionsDeceptive narrative
✓ BLIND VALIDATION CONFIRMED THIS SCORE
Serve It Fresh
Ready to Serve20 servings
Serve it the way you want it
The Verdict
 “There's less poverty now than at any time in the history of our country.”45% Rotting Baloney — Throw It Out!Verified blind by 5 frontier AIs · Baloney Inspection Report: baloney.ai/baloney/there-s-less-poverty-now-than-at-any-time-in-the-history-of
The Baloney Sampler
The claim captures a real long-term decline: the U.S. official poverty rate was 22.4% in 1959 and 10.2% in 2025. But the U.S. Census Bureau’s official series begins only in 1959, so it cannot establish an all-time low across the country’s entire history.
The superlative also depends on the measure. The official rate reached 10.5% in 2019, while the broader Supplemental Poverty Measure was 13.1% in 2025, far above its 7.8% low in 2021. The Census Bureau also reported 34.5 million people in poverty in 2025, showing that a lower rate does not necessarily mean fewer poor people.
Resting on U.S. Census Bureau · U.S. Census Bureau · U.S. Census Bureau · U.S. Census Bureau
Written from the panel’s reports by Perplexity · sonar-pro. Nothing here changed the score.
The Order Ticket
17:53:21CLAIM RECEIVED — QUEUED FOR INSPECTION✓
17:53:21claude-opus-5 REPORT CARRIED OVER FROM THE EARLIER RUN — SCORE 48, CONFIDENCE 86✓
17:54:11gpt-5.5 REPORTED — SCORE 52, CONFIDENCE 86✓
17:53:21gemini-3.1-pro-preview REPORT CARRIED OVER FROM THE EARLIER RUN — SCORE 45, CONFIDENCE 95✓
17:53:21sonar-pro REPORT CARRIED OVER FROM THE EARLIER RUN — SCORE 28, CONFIDENCE 91✓
17:53:21grok-4.6 REPORT CARRIED OVER FROM THE EARLIER RUN — SCORE 22, CONFIDENCE 78✓
17:54:59PRIMARY MASTER PERPLEXITY — SCORE 48✓
17:54:41BLIND VALIDATION CHATGPT — SCORE 42✓
17:54:43AGREEMENT CONFIRMED — DELTA 3✓
17:54:43SCORING MODEL V2 — MEDIAN OF 5 COUNTED LAB SCORES: 48, 52, 45, 28, 22 → 45.✓
17:54:43SOURCE RULE — LABS CITED 23 SOURCES: 0 DISCARDED FOR HAVING NO URL, 1 DISCARDED AS DEAD LINKS (404/410), 2 COULD NOT BE OPENED BY US AND ARE MARKED UNVERIFIED.✓
17:54:43SOURCE RULE — PRIMARY MASTER RULED ON 14 SOURCES: 0 DISCARDED FOR HAVING NO URL, 0 DISCARDED AS DEAD LINKS, 2 MARKED UNVERIFIED, 12 VERIFIED.✓
How This One Was Sliced
Station 1 · Blind Inspection — Five Graders, Zero Peeking
Each lab scored the claim independently, without seeing the others. Open a breakdown for its evidence, its sources, and how sure it was.
Anthropic · EQUAL WEIGHT · 61.8s
claude-opus-5
48%BALONEY
ROUND-1 BREAKDOWN
Evidence offered for the claim- By the long historical record, U.S. poverty is dramatically lower than in most of the nation's past: pre-1959 retrospective estimates (e.g., Mollie Orshansky/Gordon Fisher-style back-casts and consumption studies) put the poverty rate around 40% in the late 1940s and roughly 22% when the official series began in 1959, versus roughly 11% today.
- The official poverty measure (OPM) has hovered near its all-time recorded low in recent years: 10.5% in 2019 (the lowest in the 1959–present official series), 11.5% in 2022, 11.1% in 2023, and about 10.6% in 2024 — i.e., current poverty is statistically close to the best figure ever recorded by the U.S. Census Bureau.
- Consumption-based poverty measures (Meyer & Sullivan) show a far larger long-run decline than the official income measure, implying today's absolute material deprivation is near the lowest ever recorded in the U.S.
- Because no official statistics exist before 1959, the claim cannot be disproven for the 19th and early 20th centuries — and by any reasonable reconstruction, poverty then was far higher than now, so the claim is directionally right over the long sweep of U.S. history.
Evidence against the claim- The statement as written ('less than at any time') is a superlative that the data do not support: the record low official poverty rate is 10.5% (2019), and every year since has been equal to or higher, including 11.5% (2022), 11.1% (2023) and ~10.6% (2024). 'Now' is therefore not the lowest point on record.
- Under the Supplemental Poverty Measure (SPM), which accounts for taxes, transfers and living costs, poverty hit a record low of 7.8% in 2021 (child SPM poverty 5.2%), then more than doubled for children and rose to 12.4% in 2022 and 12.9% in 2023 after the expanded Child Tax Credit and pandemic aid expired. By this measure, poverty today is clearly higher than three years ago.
- Measured by the number of people in poverty — a plain reading of 'less poverty' — roughly 36–38 million Americans have been poor in recent years, versus an all-time low of about 22.9 million in 1973. In absolute head-count terms, poverty is far from its historic minimum.
- The official poverty series only begins in 1959, so any claim about 'any time in the history of our country' rests on estimates that the federal government does not publish, making the claim unverifiable as stated.
- Child poverty specifically: the SPM child poverty rate rose from 5.2% (2021) to 12.4% (2022) and 13.7% (2023), one of the sharpest increases on record — directly contradicting the idea that poverty is currently at an all-time minimum.
How sure this lab was86/100 — the lab’s own confidence in the score above, not a second reading of the claim.
SourcesU.S. Census Bureaugov · 97 · U.S. Census Bureau (Poverty in the United States: 2023, P60-283)gov · 97 · U.S. Census Bureau newsroomgov · 95 · U.S. Census Bureau (Supplemental Poverty Measure)gov · 95 · Columbia University Center on Poverty and Social Policyedu · 88 · National Bureau of Economic Research (Meyer & Sullivan, 'Winning the War: Poverty from the Great Society to the Great Recession')journal · 88 · Center on Budget and Policy Prioritiesother · 78
OpenAI · EQUAL WEIGHT · 50.6s
gpt-5.5
52%BALONEY
ROUND-1 BREAKDOWN
Evidence offered for the claim- Using the official U.S. poverty measure, poverty is much lower than in the earliest comparable Census data: Census historical tables show a 22.4% poverty rate in 1959 versus 11.1% in 2023. That supports the weaker idea that poverty is near historic lows and far below much of the measured post-1959 period.
- Recent official poverty rates are low by historical standards: the Census Bureau reported the 2023 official poverty rate at 11.1%, close to the record-low 10.5% rate reached in 2019.
- Research using broader income or consumption-based measures also finds large long-run reductions in U.S. poverty since the 1960s, especially after accounting for taxes, transfers, and in-kind benefits; this supports the general long-term direction implied by the claim.
Evidence against the claim- The claim says poverty is lower now than at any time, but Census official poverty data contradict that: 2023's official poverty rate, 11.1%, was higher than 2019's 10.5%, so the latest comparable official rate was not the lowest ever measured.
- The Census Supplemental Poverty Measure also contradicts the claim. The 2023 SPM rate was 12.9%, far above the 2021 SPM rate of 7.8%, which was unusually low because of pandemic-era tax credits and relief programs.
- If 'less poverty' means the number of people in poverty rather than the rate, the claim is even weaker: Census reported 36.8 million people in official poverty in 2023, more than in 2019 and necessarily more than many earlier periods when the entire U.S. population was much smaller.
- The phrase 'at any time in the history of our country' overstates what the data can show. The main official Census poverty series begins in 1959, so an all-of-U.S.-history claim is not directly verifiable with the official measure.
How sure this lab was86/100 — the lab’s own confidence in the score above, not a second reading of the claim.
SourcesU.S. Census Bureaugov · 98 · U.S. Census Bureaugov · 96 · U.S. Census Bureaugov · 96 · National Bureau of Economic Researchother · 85 · Journal of Economic Perspectives / American Economic Associationjournal · 88
Google · EQUAL WEIGHT · 31.7s
gemini-3.1-pro-preview
45%BALONEY
ROUND-1 BREAKDOWN
Evidence offered for the claim- Poverty rates in the United States are currently very low when viewed in the broad context of long-term American history, remaining below the historical averages of the past 60 years.
- When accounting for government assistance and tax credits via the Supplemental Poverty Measure (SPM), the U.S. poverty rate reached a true, all-time record low of 7.8% recently in 2021, which is often the basis for contemporary political claims about record-low poverty.
Evidence against the claim- The claim is factually false when measuring absolute numbers instead of rates; due to population growth, there are over 36 million Americans in poverty today, which is significantly higher than the roughly 23 million impoverished Americans in 1973.
- The Official Poverty Measure (OPM) was 11.1% in 2023. While historically low, this is demonstrably higher than the actual record low of 10.5% achieved just prior to the pandemic in 2019.
- The Supplemental Poverty Measure (SPM) rose to 12.9% in 2023 following the expiration of pandemic-era safety net programs (like the expanded Child Tax Credit), meaning poverty today is tangibly higher than it was at its 2021 nadir.
How sure this lab was95/100 — the lab’s own confidence in the score above, not a second reading of the claim.
SourcesU.S. Census Bureaugov · 100 · U.S. Census Bureaugov · 100
Perplexity · EQUAL WEIGHT · 8.4s
sonar-pro
28%BALONEY
ROUND-1 BREAKDOWN
Evidence offered for the claim- Using the Census Bureau’s official poverty measure, the U.S. poverty rate was 22.4% in 1959, the first year of the comparable series, versus 10.6% in 2024 and 10.5% in 2025. This supports the narrower claim that the official poverty rate is far below its historical level.[https://www.census.gov/library/publications/2025/demo/p60-287.html][https://www.census.gov/library/publications/2026/demo/p60-290.html]
- The official poverty rate fell to 10.6% in 2024, with 35.9 million people classified as poor.[https://www.census.gov/library/publications/2025/demo/p60-287.html]
- Long-run reductions in poverty are partly attributable to government programs and tax credits; broader measures that account for taxes and noncash benefits show that policy substantially reduces measured poverty, although they do not establish an all-time low.[https://www.census.gov/library/publications/2025/demo/p60-287.html]
Evidence against the claim- The statement says “less poverty” without specifying a measure. Under the Supplemental Poverty Measure, which includes taxes, government transfers, and necessary expenses, the poverty rate was 13.1% in 2025 and was not statistically different from 2024.[https://www.census.gov/library/publications/2026/demo/p60-290.html]
- The official poverty series begins in 1959, so it cannot establish that poverty is lower than at every point in the entire history of the country, including periods before 1959.[https://www.census.gov/data/tables/time-series/demo/income-poverty/historical-poverty-people.html]
- The number of people below the official poverty line is not at an all-time low: Census reported 35.9 million people in poverty in 2024, while the U.S. population is much larger than in earlier decades. A lower rate therefore does not mean fewer poor people in absolute terms.[https://www.census.gov/library/publications/2025/demo/p60-287.html]
- PolitiFact found that a similar claim conflated the number of people in poverty with the poverty rate: the number of poor people was higher in 2014 than in 1959, while the rate was lower. That distinction applies to this statement as written.[https://politifact.com/factchecks/2015/nov/01/carly-fiorina/fiorina-defends-her-gop-debate-remarks-claims-us-h/]
- The broader SPM measure was 12.9% in 2024, 2.3 percentage points higher than the official rate, illustrating that the conclusion depends materially on which definition of poverty is used.[https://www.census.gov/library/publications/2025/demo/p60-287.html]
How sure this lab was91/100 — the lab’s own confidence in the score above, not a second reading of the claim.
SourcesU.S. Census Bureaugov · 99 · U.S. Census Bureaugov · 99 · U.S. Census Bureaugov · 99 · PolitiFactfactcheck · 94
xAI · EQUAL WEIGHT · 71.7s
grok-4.6
22%BALONEY
ROUND-1 BREAKDOWN
Evidence offered for the claim- U.S. Census official poverty rate fell from 22.4% in 1959 (start of consistent series) to 11.1% in 2023, with a series low of 10.5% in 2019; rates in the 11% range are far below mid-20th-century levels.
- Absolute material conditions for low-income households improved dramatically across U.S. history: indoor plumbing, electricity, refrigeration, vaccines, and basic consumer durables that were rare or absent in the 19th and early 20th centuries are now typical even among the poor.
- Mass destitution, famine, and poverty-driven mortality that characterized large parts of the 18th–early 20th centuries (including the Great Depression) no longer describe the United States.
Evidence against the claim- The 2023 official poverty rate of 11.1% is higher than 2019’s 10.5%, so poverty is not lower than at every prior point in the measured series.
- HUD point-in-time homelessness reached a record 653,104 people in 2023, a sharp rise from prior years.
- USDA data show household food insecurity at 13.5% in 2023, above the 10.5% rate in 2019.
- The official poverty measure uses a 1960s food-cost multiplier, omits many in-kind benefits and geographic cost differences; the Supplemental Poverty Measure and other hardship indicators show different recent trends, including a 2021 drop from pandemic transfers followed by reversal.
- Relative poverty (share below 50% of median) and income inequality are higher than in some earlier postwar decades.
How sure this lab was78/100 — the lab’s own confidence in the score above, not a second reading of the claim.
SourcesU.S. Census Bureaugov · 96 · U.S. Census Bureaugov · 96 · U.S. Department of Housing and Urban Developmentgov · 92 · USDA Economic Research Servicegov · 94
Station 2 · The Masters
Primary Master · drawn at random
sonar-pro
48% BALONEY
The statement captures a genuine long-term trend: U.S. poverty rates are far below the earliest comparable Census estimate, and material living conditions have improved substantially over the nation’s history. However, scored as written, it asserts an absolute all-time low without defining poverty, and the available measures do not support that superlative. The official poverty rate was 10.2% in 2025, near—but above—the 10.5% record low reached in 2019; the Supplemental Poverty Measure was 13.1% in 2025, well above its 7.8% low in 2021. The official series begins only in 1959, so it cannot directly verify the claim across the entire history of the country. The evaluators’ scores ranged from 22 to 52, with four reports clustering in the 41–52 range; I weight the majority view toward significant falsity while recognizing the claim’s broad historical direction. The cited Census sources are the strongest evidence and are accepted. Historical reconstructions and research on consumption support the long-run decline but do not establish that the present is the all-time minimum. The head-count interpretation also undermines the wording: tens of millions remain in poverty today, more than in some earlier periods when the population was smaller.
All five evaluators agreed that U.S. poverty is much lower than in much of the nation’s past and that the claim is too strong as written. They consistently identified the 1959 start of the official series, the 2019 official-rate low, and the higher recent SPM rate as problems. They differed mainly in emphasis and scoring: Reports 1 and 2 stressed ambiguity, absolute numbers, homelessness, food insecurity, and measurement limits; Reports 3–5 focused on the contradiction between current rates and prior lows. Report 4 accepted the broad historical context most strongly but still found the literal claim false. The reports also differed on current figures because some used 2023 or 2024 data, while the latest cited Census result reports 10.2% official poverty and 13.1% SPM poverty in 2025.
Blind Validation Master · never saw the Primary’s work
gpt-5.5
42% BALONEY
The claim is directionally true only in a broad, long-run sense: U.S. poverty rates today are far below early Census-series levels such as 22.4% in 1959, and likely far below poverty in much of the 19th and early 20th centuries. But as written it says poverty is lower now than at any time in U.S. history, which the reports do not support. The official poverty rate has been near its recorded low, but recent figures are not clearly below all prior years; reports cite 2019 at 10.5%, with later years higher or at best roughly tied. The Supplemental Poverty Measure was much lower in 2021 than in recent years, so under a broader measure poverty is plainly not at its lowest now. If 'less poverty' means the number of people in poverty, the claim is even weaker, because the current headcount is much higher than in some earlier decades due to population growth. The official series also only begins in 1959, making the all-of-history superlative unverifiable. Overall, the statement captures a real long-term decline but overstates it into a false record-low claim.
AGREEMENT TEST PASSED — MASTERS SCORED 48% AND 42% · BLIND VALIDATION CONFIRMED THIS SCORE · NO RE-EVALUATION REQUIRED
How the number was reached · scoring model v2 · how our models work
- Median of 5 counted lab scores: 48, 52, 45, 28, 22 → 45.
The Evidence
Evidence offered for the claim
- Long-term poverty decline The official poverty rate fell from 22.4% in 1959, the first year of the comparable Census series, to 10.2% in 2025. Retrospective estimates and consumption-based research also indicate much lower poverty and material deprivation than in earlier American history.
- Improved material conditions Low-income Americans today generally have access to indoor plumbing, electricity, refrigeration, vaccines, and basic consumer goods that were uncommon or unavailable to many people in the 19th and early 20th centuries. This supports a broad claim of historical improvement, though it does not prove an all-time-low poverty rate.
- Recent official rate near a record low DEBUNKED — The official poverty rate reached 10.5% in 2019 and remained near that level in subsequent years, including 10.2% in 2025. This supports describing current official poverty as historically low, but not as definitively the lowest ever.
Evidence against the claim
- Current official rate is not the record low The official poverty rate was 10.2% in 2025, while the lowest rate in the published 1959–present series was 10.5% in 2019. Thus the latest figure is near the series low but does not establish the claim’s absolute superlative.
- Broader measure gives a different result The Supplemental Poverty Measure was 13.1% in 2025, compared with a reported low of 7.8% in 2021 after pandemic-era tax credits and relief programs. Poverty therefore depends materially on the definition used.
- The historical series is limited The Census official poverty series begins in 1959. It cannot directly demonstrate that poverty is lower now than at every point in U.S. history, even though retrospective estimates indicate much higher poverty in earlier decades.
- People in poverty are not at an all-time minimum Census counted 34.5 million people in official poverty in 2025 and 35.9 million in 2024. Because the population was much smaller in earlier periods, the number of people in poverty can be higher today even when the poverty rate is lower.
- Other hardship indicators complicate the claim The evaluators cited elevated homelessness and food insecurity in recent years, along with limitations of the official measure, including its treatment of noncash benefits and geographic cost differences. These indicators do not support treating one poverty-rate statistic as a complete measure of hardship.
Sources · Reliability · Why Accepted or Discounted
Every link was opened when this claim was inspected. A dead link was discarded before publication; “unverified” means the site refused our automated check and the link is the one the panel cited. A source without a URL was never kept.
Serve It Fresh
Ready to Serve20 servings
Serve it the way you want it
The Verdict
“There's less poverty now than at any time in the history of our country.”45% Rotting Baloney — Throw It Out!Verified blind by 5 frontier AIs · Baloney Inspection Report: baloney.ai/baloney/there-s-less-poverty-now-than-at-any-time-in-the-history-of